Leantycoon
Loading...
Loading...
Quality doesn't happen by chance — it's achieved through data, analysis, and continuous improvement.
The 7 QC (Quality Control) Tools are the fundamental techniques used in Lean and Six Sigma to identify, analyze, and solve quality problems in any process.
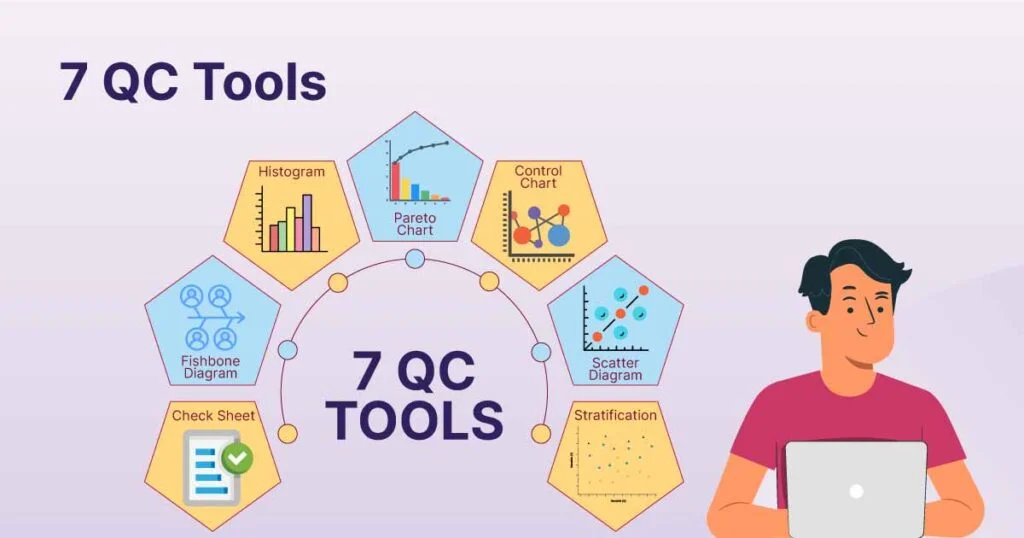
Popularized by Kaoru Ishikawa, these tools help teams make decisions based on facts rather than assumptions — ensuring consistent product and process quality.
A structured data collection form used to record frequency of issues.
Identifies the most significant problems using the 80/20 principle.
Helps identify root causes by categorizing contributing factors.
Displays data distribution to detect variation or trends.
Monitors process stability over time and distinguishes normal vs special variation.
Shows relationships between two variables to detect correlations.
A step-by-step visual representation of a process to identify bottlenecks and waste.
The 7 QC Tools may be simple, but they are incredibly powerful when applied consistently. They transform raw data into actionable insights and guide teams toward sustainable quality improvement.
"Quality improvement begins with understanding — and the 7 QC Tools help you see what really matters."